CPIC API coverage: 108 pharmacogenomic recommendations
INCOPREA / RESEARCH
A descriptive database audit — preprint draft, not peer reviewed. This is not medical advice.
Read the full article · Download the data
Pharmacogenomic guidance turns a genotype into a prescribing decision. The frequencies that make that guidance operational come from particular study populations. So we asked a narrow, checkable question of one public database: for how many recommendations does the CPIC API actually return a computed phenotype frequency, and for which ancestry groups?
The answer is narrower than the headlines that usually follow this kind of question, and it is worth stating precisely.
What we found
Of 108 actionable gene–drug pairs in the snapshot — 21 genes, 27 guidelines — 62 had a computed phenotype frequency for at least one ancestry group. Forty-five had allele-frequency records but no computed phenotype value. One pair, ivacaftor and CFTR, had neither.
That means 46 of 108 pairs (42.6%) lack a computed ancestry-specific phenotype frequency in the field we audited.
That sentence is doing a lot of work, and it is easy to overstate. This is a statement about which fields a database returns. It is not a statement that the evidence does not exist, that a guideline is unsupported, or that nobody has measured the frequency. CPIC recommendations can key on phenotype, on an activity score, or on allele status; for allele-defined guidance, allele frequencies may be exactly the right measure.
Where frequencies exist, they are often incomplete
Six of the ten genes with any phenotype frequency covered fewer than nine ancestry groups.
NUDT15 covered four of nine. NAT2 five. CYP3A5 and TPMT seven each. For NUDT15, five groups had no estimate in the snapshot.
Again: an absent field is not proof of absent research. It is a gap in what this resource exposes.
Where frequencies exist, they differ
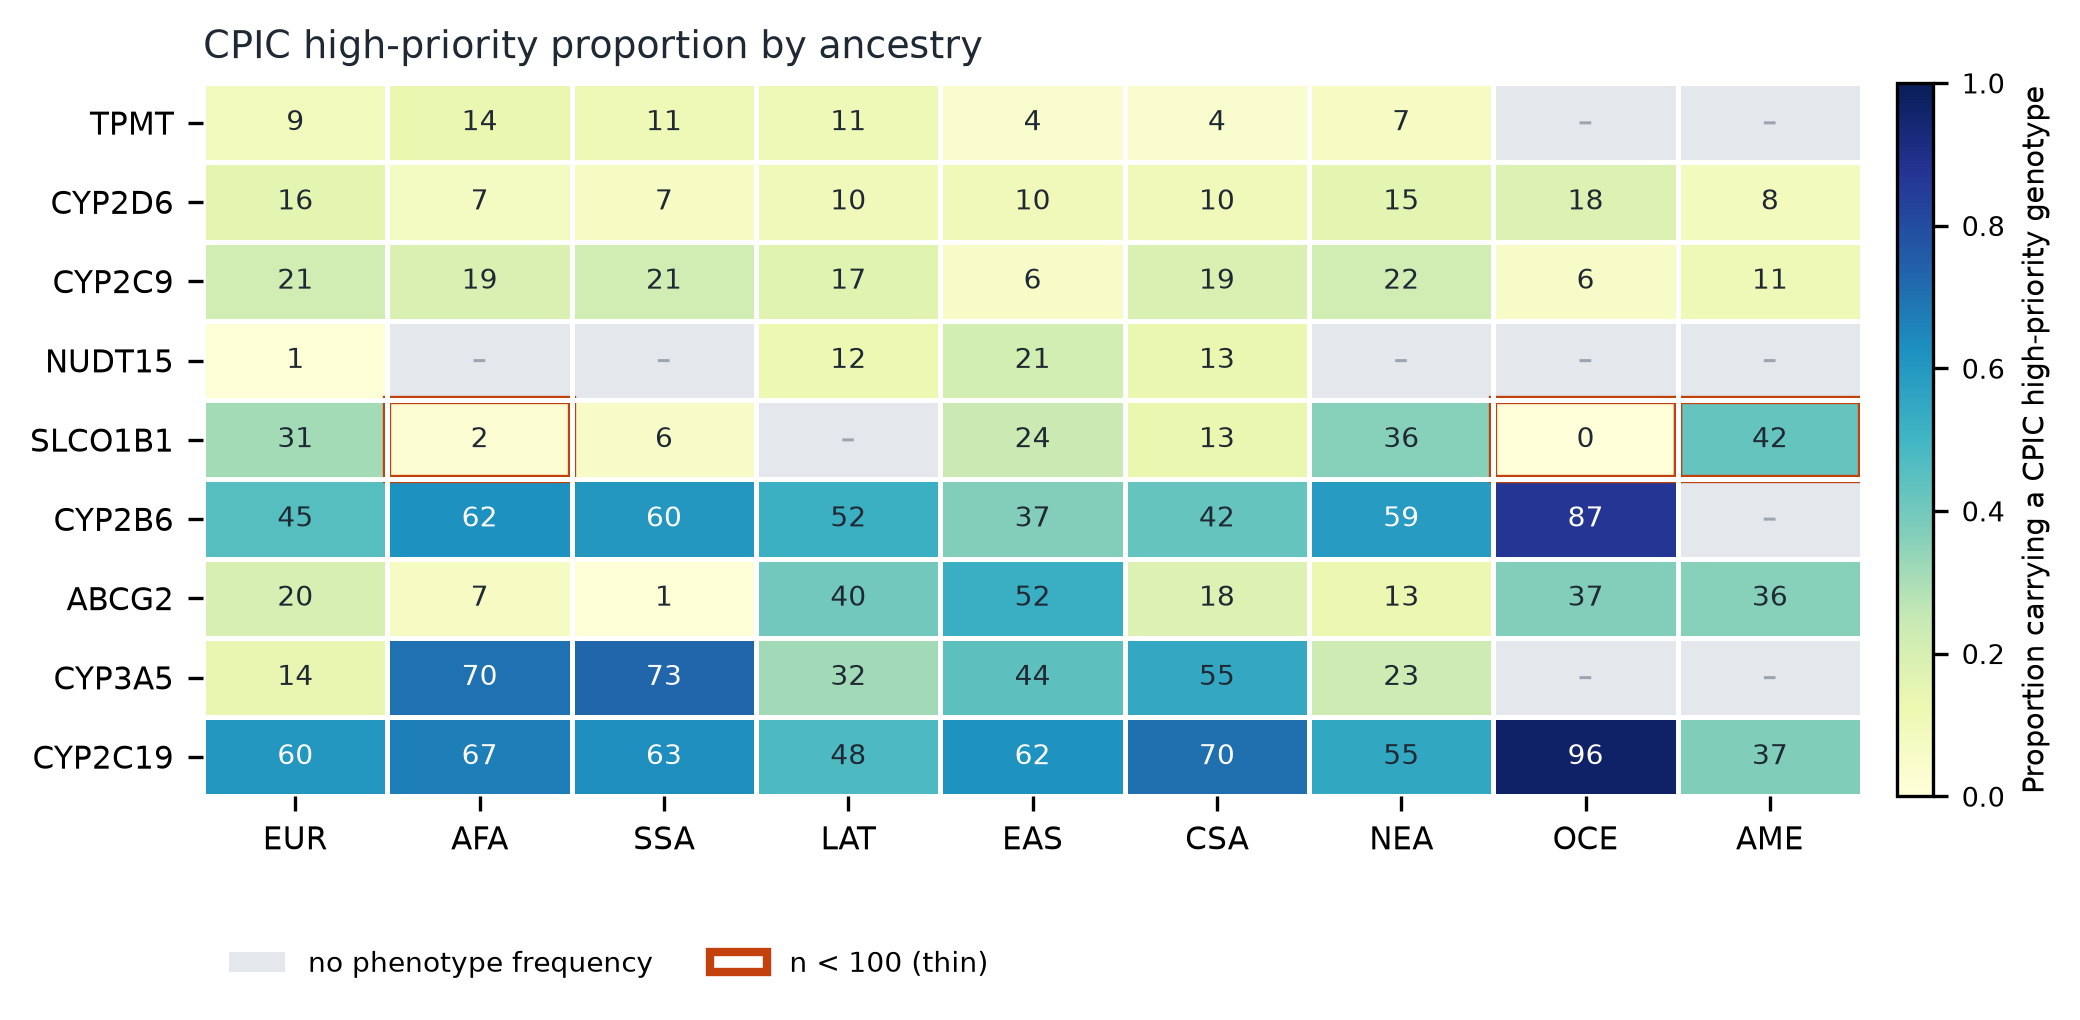
We summed the phenotype categories that CPIC's own ehrpriority field marks for clinical attention. We call this the CPIC high-priority proportion. It is a clinical-attention label, not a calibrated probability of harm, and it aggregates categories that move in opposite directions — an ultrarapid and a poor metaboliser are both flagged.
Across 61 rankable pairs, the median difference between the lowest and highest ancestry group was 16.1 percentage points, and 25 pairs exceeded 20 points. An important caveat: those 25 pair-level results are not 25 independent contrasts. They repeat five gene-level estimates — CYP2C19 (14 pairs), SLCO1B1 (7), CYP2B6 (2), ABCG2 (1), CYP3A5 (1).
The number that needs the most care
Three of 75 gene–ancestry cells had a support proxy below 100, all for SLCO1B1: African American/Afro-Caribbean 38, Oceanian 28, American 64. The Oceanian cell is 0.0% and the American cell 42.2%.
It is tempting to call that contrast an artefact. This audit cannot support that conclusion.
The proxy is the largest subjectcount among allele-level records in a cell. It is not a demonstrated denominator for the phenotype estimate and not a count of unique people. We did not reconstruct a denominator or propagate uncertainty, so we cannot say whether the contrast reflects sampling variation, cohort composition, modelling assumptions, or a population difference. It requires cautious interpretation and further validation.
That caution applies to every cell in the dataset, not only the small ones.
One more correction worth making explicitly: the SLCO1B1 42.2% is a composite — 36.48% Decreased Function plus 5.76% Poor Function — not Decreased Function alone.
HLA carrier frequencies
For allele-defined guidance the allele table is the relevant measure. Under Hardy–Weinberg, estimated carrier frequency of HLA-B*57:01 runs from about 1.2% in African American/Afro-Caribbean and Sub-Saharan African groups to 13.2% in Central/South Asian groups. HLA-B*15:02 runs from roughly 0% to 8.9%; HLA-B*58:01 from 1.5% to 11.7%.
These are population prevalence estimates for a genotype. They are not the risk of a reaction in a person whose genotype is already known.
What this does and does not support
It supports the descriptive counts: 46 of 108 pairs lack the phenotype field; six of ten phenotyped genes are incomplete; the composite proportions vary across groups.
It does not support any claim that 43% of clinical recommendations lack evidence, that a particular contrast is noise, or that ancestry-specific treatment policy should change. It measured fields in one API snapshot. It is not a systematic review, and no independent clinical review has been performed.
Why publish it anyway
Because the field-level gap is real and easy to fix. A resource that publishes, alongside every frequency, which ancestry groups it covers and what support stands behind each cell would make the next analysis much easier — and would let readers tell a measured value from an assumed one.
That is a documentation ask, not a clinical claim.
Read the article, with methods, figures and limitations: incoprea.com/research
Research, analysis and drafting were prepared with DeepSeek Harness. Internal consistency of the supplied processed tables was checked during preparation. No independent clinical review has been performed. This descriptive database audit is not medical advice.
Comments
Post a Comment